


The future of work is usually discussed in one of two unhelpful ways.
Either it is treated like a disaster movie — every job is about to disappear — or it is treated like a buzzword buffet, full of vague claims about “the future” with very little evidence behind them.
NexFuture™ is NexPath's brand name for the NexPath Future Index (NFI). It was built to do something more practical.
It is a structured way to understand how occupations are likely to change over time, which parts of a role are more exposed to automation, and which parts are anchored by human strengths.
In other words: it is not a crystal ball. It is a decision aid.
NexFuture™ does not ask, “Will this job vanish?”
It asks, “What will this occupation look like in 10–20 years, and what should we do about it now?”
The Core Shift: ESCO-Native Foresight (v3.0)
In its earlier version (v2.0), NexFuture™ relied on mapping ESCO occupations to O*NET profiles to import ability and work-activity data. However, this approach introduced limitations: only about 30% of global occupations had native O*NET coverage, and physical/safety-critical roles (like firefighters) were often mischaracterized as highly automatable due to raw physical ability scores.
With NexFuture™ v3.0, the system is fully ESCO-native.
Instead of routing through external proxies, NFI scores are calculated directly from each occupation's ESCO skill composition across all 3,039 standardized EU occupations. By evaluating the essential and optional skills defined for each role, the model achieves 100% native coverage and significantly improved face validity. Hands-on, safety-critical, and caring roles are now correctly identified as low-exposure, while routine information-processing roles are flagged for transition.
Architecture: Core vs. Deferred Demand
NexFuture™ v3.0 separates occupational foresight into two distinct, clean layers:
- CORE (Global Automation & Resilience Outlook): This is a location-independent metric. It measures how exposed a role's tasks are to automation, the durability of its human skills core, and how soon structural transformation is likely to occur.
- DEMAND (Location-Dependent Growth Outlook): Sourced from regional labor-market data (local vacancies, wage trends, and regional economic policies), this layer answers whether a specific market needs more of this occupation. Because this depends on geography (e.g., care demand in aging societies), the demand layer is deferred to location-specific datasets and is not mixed into the core global index.
How the Core Score is Calculated
The NFI core score is built on the skill-mass-weighted mean automatability of the occupation's essential and optional skills.
Each of ESCO's 13,492 distinct skills maps to a specific skill group (e.g., advising, calculating, constructing). Each group carries a fixed automatability coefficient (0 to 1) grounded in automation research (Frey & Osborne, Autor, Eloundou et al.).
- Skill Mass: Essential skills contribute a weight of 1.0; optional skills contribute 0.5. This weight is further scaled by the skill's reuse level (occupation-specific skills have higher mass, while transversal skills have a lower weight).
- Core Score: The raw mean coefficient is calculated and normalized to a 0–1 scale:
[\text{Raw Exposure} = \frac{\sum (\text{automatability} \times \text{mass})}{\sum \text{mass}}]
This raw exposure is then mapped to the final
0.0(minimum exposure) to1.0(maximum exposure) scale.
The Four Technology Vectors
To help users understand where automation pressure originates, the NFI decomposes exposure into four technology classes based on the primary skill groups involved:
- Robotic Physical: Physical automation, machinery handling, construction, and manual operations (anchored in ESCO groups S6, S7, and S8).
- Cognitive Software: Workflow automation, document handling, spreadsheet calculations, and administrative processing (anchored in business/administrative knowledge domains).
- AI / ML: Pattern recognition, analytical processing, data science, and system administration (anchored in ESCO analytical and IT groups S2, S5, and 06).
- Generative AI: Content generation, drafting, communication, artistic creation, and language-heavy tasks (anchored in ESCO groups S1, 02, and 03).
By breaking the score down into these vectors, a learner can see whether a role faces physical automation pressure, administrative software changes, or Generative AI augmentation.
Automation-Resilience Outlook & Tiers
The counterpart to exposure is Resilience — a measure of how durable the human core of an occupation is. It is calculated by taking the inverse of the exposure score and lifting it based on the density of human-centric skills:
[\text{Outlook} = 0.80 \times (1 - \text{Exposure}) + 0.12 \times \frac{\text{Transversal Essential}}{\text{Total Essential}} + 0.08 \times \frac{\text{Caring/Assisting Essential}}{\text{Total Essential}}]
This outlook categorizes occupations into three distribution-relative tiers (terciles across the entire 3,039-occupation database):
- Top (High Resilience / Future-Strong): Occupations with a strong human core, high coordination, or complex caring requirements (e.g., midwives, senior managers, special education teachers).
- Mid (Evolving): Occupations that will undergo significant workflow tool changes but are highly adaptable (e.g., software developers, graphic designers).
- Bottom (At Risk): Occupations highly exposed to automation that require active transition planning and upskilling (e.g., billing clerks, data entry typists). The legacy "Critical Transition" tier has been consolidated here.
The Transformation Timeline
Using the core exposure score, NexFuture™ calculates a central estimate of the number of years until the occupation faces major task-level transformation:
[\text{Estimated Years} = 20 - (15 \times \text{Exposure})]
- High-Exposure Roles: Face significant changes within 7 to 11 years.
- Low-Exposure Roles: Remain structurally stable, with timelines extending to 16 to 20 years.
What the Numbers Actually Look Like
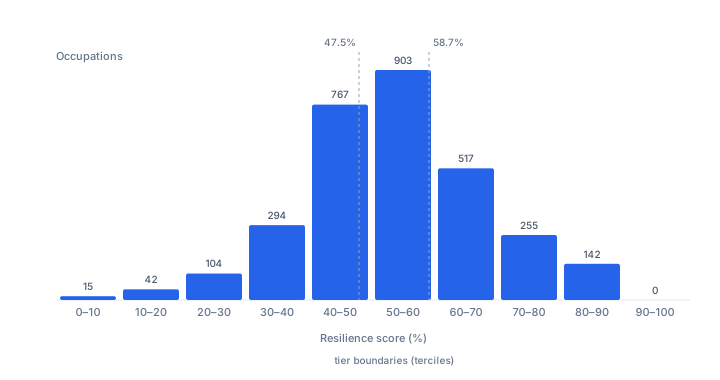
A model is only as honest as the distribution it produces. Here is every one of the 3,039 scored ESCO occupations, measured in August 2026:
| Statistic | Resilience score | Automation exposure |
|---|---|---|
| Minimum | 1.4% | 0.0% |
| 10th percentile | 36.4% | 10.4% |
| Lower tercile (tier boundary) | 47.5% | — |
| Median | 53.3% | 34.3% |
| Upper tercile (tier boundary) | 58.7% | — |
| 90th percentile | 73.3% | 54.7% |
| Maximum | 88.0% | 98.3% |
Three things are worth reading off this.
The distribution is single-peaked and narrow. Two thirds of all occupations sit between roughly 44% and 63%. That is not a hedge — it reflects something real: most work is a mixture of automatable and non-automatable tasks, and very few occupations are purely one or the other.
The tiers are thirds, not grades. The boundaries fall at 47.5% and 58.7%, splitting the database into 1,021 / 1,005 / 1,013 occupations. "Future-Strong" therefore means top third relative to every other occupation — not "this job is safe". An occupation scoring 59% is in the top tier; one scoring 58% is not; the difference between them is not meaningful on its own.
Confidence is high almost everywhere. 2,879 occupations score at high confidence, 158 at medium, and 2 at low. Confidence here reflects how much essential-skill data ESCO holds for that occupation, not how certain we are about the future.
The Uncomfortable Part: Read the Extremes Honestly
Any index that ranks 3,039 things will be judged on its extremes. Here are ours, unedited:
Highest resilience: escort (88%), door supervisor (87%), security guard (86%), immigration officer (86%), usher (85%).
Lowest resilience: personal property appraiser (1%), file clerk (3%), insurance risk consultant (4%), compensation analyst (4%), accounting analyst (4%).
The bottom of that list is intuitive: highly structured, information-processing work with well-defined rules is exactly what current systems automate well.
The top is where readers reasonably object. These are not high-status or high-paying occupations, and no career adviser would hand someone a list headed by "escort" and call it guidance. But the ranking is doing exactly what it claims: measuring how exposed an occupation's skill profile is to automation. Physical presence, situational judgement and human interaction remain genuinely hard to automate, and roles built almost entirely from them score high.
This is the single most important caveat about NexFuture™: a high resilience score is not a recommendation. It says a technology is unlikely to eliminate the work. It says nothing about pay, working conditions, demand, entry requirements, or whether the job is one you would want.
That is why the score never appears alone on a NexPath occupation page. Beside it sit the labour-market layers — current shortage or surplus, employment forecasts to 2035, occupation size, and regulatory status — measured per country. Resilience is a global, structural property of the work. Demand is local and changes with the year. Collapsing them into one number would destroy both.
We publish the awkward extremes rather than trimming them because a foresight model that only shows its flattering cases is not a model — it is marketing.
Why This Matters
NexFuture™ v3.0 provides a realistic, explainable model for the future of work:
- For Learners: It shifts the conversation from panic ("Will my job disappear?") to planning ("Which skills should I focus on to increase my resilience?").
- For Counselors: It offers clear, data-backed reasoning to explain why a career path is changing and helps suggest adjacent, more resilient transitions.
- For Employers: It aids in workforce development by showing which roles will require reskilling support.
By grounding every score in ESCO skill relations and removing generic placeholders, NexFuture™ v3.0 remains an honest, actionable decision aid for the modern workforce.